Humber Estuary, UK

In the United Kingdom (UK), the main drivers of flood risk are rainfall, tides and storm surges, while secondary risk drivers are from wave overtopping and wave setup. Currently, flood risk management is well developed, given the many flood defenses and flood forecasting capabilities. However, climate change brings about uncertainties in frequency and intensity changes. As such, compound flood events may happen more frequently in deltaic or estuarine areas. Due to the complex interaction between riverine and coastal components, compound flooding is more difficult to model, making estuaries especially interesting.
With this in mind, the Humber area is an interesting case study area to explore within this project. The Humber Estuary is located in the eastern part of England. Its low-lying nature, along with its vast catchment area, makes it highly vulnerable to flooding. It is an estuary with a high population density, combined with industrial and agricultural activities. Owing to its dense urban planning, flood risk is high in this area due to the broad potential impacts, with the notable floods of December 2013. Within the Humber area, a mix of hard and soft measures are presently implemented to reduce the risk of coastal flooding and erosion.
Within the UK, the Environment Agency is tasked with flood risk management. In this project, the Environment Agency is the end users for the Humber Estuary case study.
User

The Environment Agency is the government agency primarily responsible for flood risk management in England. Their flood and coastal risk management services include: 1) Flood incident management for forecasting, warning and response 2) Asset management for maintaining, operating, improving, building or creating assets 3) Strategy and investments for understanding risk, planning and defining investment needs, and detailed design and options appraisal. The Environment Agency and Deltares has a long working relationship, as the UK was one of the first countries where a Delft-FEWS forecasting system was implemented.
Current forecasting infrastructures
A fluvial Delft-FEWS forecasting system and coastal look-up model are currently in place. The model used for the fluvial forecast is the Humber 1D Flood Modeller Pro (FMP) model constructed by the Environment Agency. Thresholds for acceptable water levels are determined beforehand. When values are exceeded during the forecast, these trigger action protocols such as mitigation or evacuation. To properly support evacuation measures, an accurate lead time of 3 days is required.
Local Digital Twin implementation
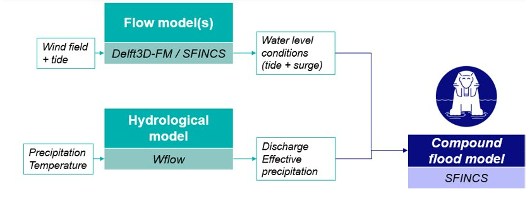
The model chain for the Humber estuary includes a sub-selection of model from the full DestinE Modelling Framework (see Figure 4‑2).
We implemented the Delft3D-FM model (see Figure 4‑3) for the simulation of sea water levels and tights for La Reunion largely automatically. The flexible mesh model grid increases in resolution close to the coast and in the estuary. The model performance can be further improved by integration of higher resolution local bathymetry data.
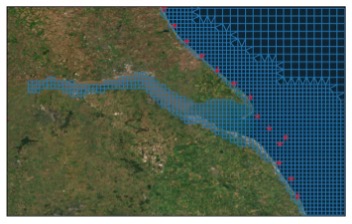
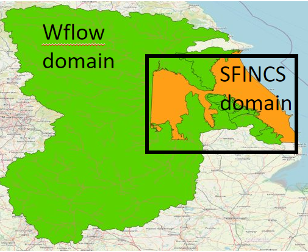
The hydrological model wflow_sbm is implemented for the entire upstream catchment area. Close to the coast and in the estuary the hydrodynamics are simulated with the flood inundation model SFINCS (see Figure 4‑4).
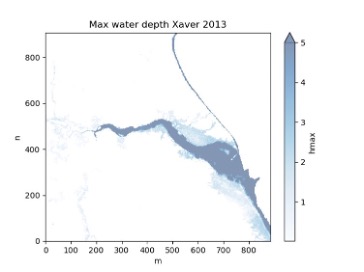
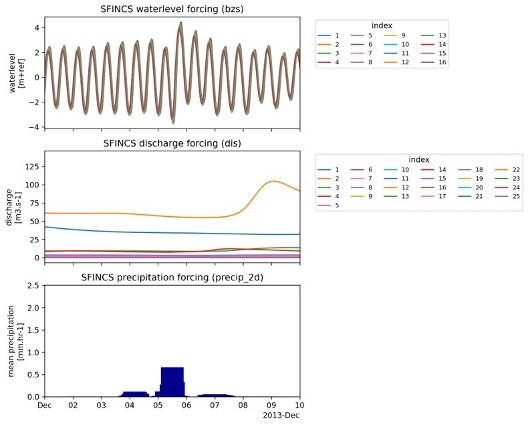
The SFINCS model takes water levels from Delft3D-FM as coastal boundary conditions and river discharge from wflow_sbm as upstream river boundary conditions (see Figure 4‑5). The models are forced with meteorological data from the ERA5 re-analysis dataset. For the Tier-1 dataset we simulated the winter storm Xaver (December 2013).
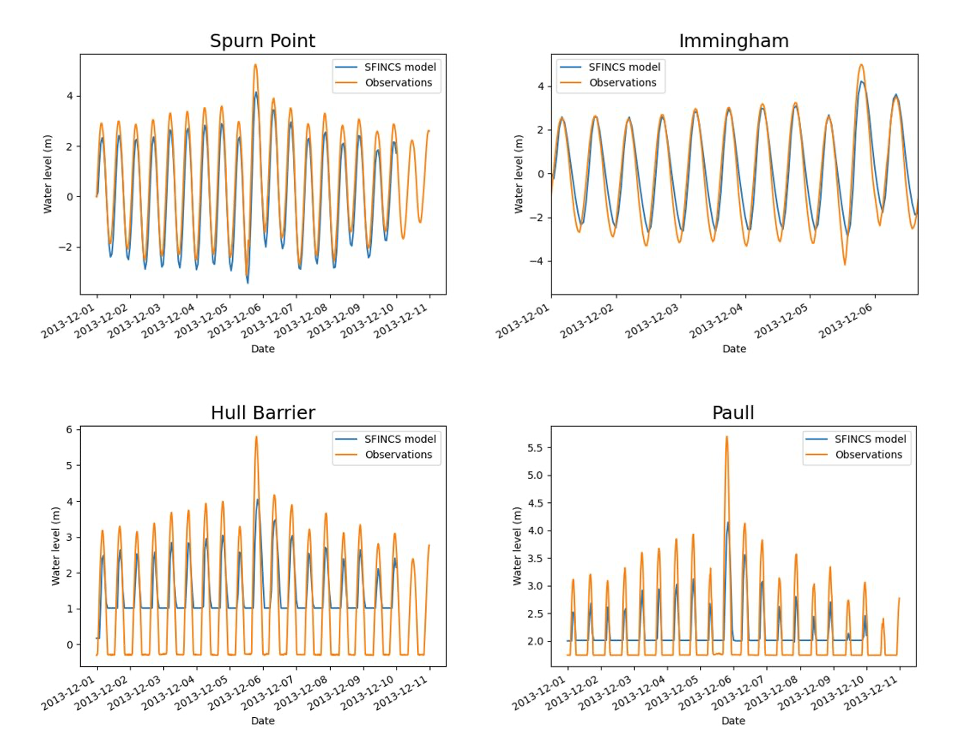
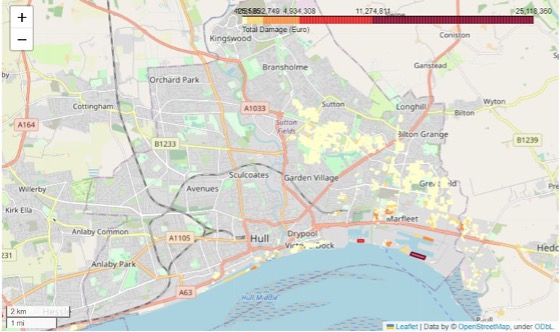
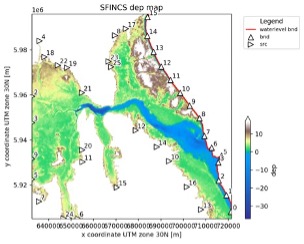
SFINS calculates the flood maps for the event, Figure 4‑6 displays the maximum water depth during the storm and Figure 4‑7 the validation of simulated water levels. Based on the SFINCS flood depth maps the total damage per building was assessed with Delft-FIAT (Figure 4‑8). The damage values and flood depth modelling still need to be improved. The user explained that not all protection structures were already correctly implemented in the SFINC model.