Pilot service dynamic line rating: first results
Within the Destination Earth initiative, the Pilot ServiceRegular provision of technological capabilities, resources, More Dynamic Line Rating explores how high-resolution forecasts can support smarter grid operation and planning. The first results demonstrate the strong potential of dynamic line rating to increase the ampacity (i.e. the maximum current a line can conduct continuously without exceeding its maximum temperature of high-voltage transmission lines.)
Combined impact of meteorological variables
Traditionally, transmission system operators rely on static line ratings, underutilizing the capacity of transmission lines. In a system facing growing peaks in demand and variable renewable generation, this conservatism becomes a bottleneck.
Dynamic Line Rating (DLR) provides a smarter alternative. By adjusting line capacity based on actual weather conditions, DLR allows operators to safely push more power through existing lines.
The pilot service uses a compound event detection methodology that evaluates the combined impact of key meteorological variables, including wind, temperature, solar radiation and precipitation, rather than single-parameter thresholds. This reflects the physical heat balance of overhead conductors, where multiple processes interact. For example, high temperatures can be offset by wind or rainfall, while low wind speeds combined with high solar radiation may create unfavourable operating conditions due to reduced cooling and increased heating.
To support operational decision-making, the project uses scientifically established thresholds derived from international recommendations such as CIGRE.
| Parameter | Critical (Unfavorable) | Favorable | Physical Basis |
| Wind speed | < 2 m/s | > 5 m/s | Convective cooling dominates heat dissipation; scales with Re^0.5 |
| Ambient temperature | > 30°C | < 20°C | Temperature gradient (Tc – Ta) drives convective/radiative transfer |
| Solar radiation | > 600 W/m² | < 400 W/m² | Direct heating of conductor surface; absorbed via αs coefficient |
| Precipitation | — | > 0.1 mm/h | Evaporative cooling enhancement: 20-50% increased heat transfer |
The detection system produces an operational score that indicates favorable or unfavorable situations. This scoring approach allows grid operators to anticipate risks and adapt the capacity of their transmission lines.
| Score | Category | Definition | Operational Action |
| ≤ -2 | Very Unfavorable | Multiple critical thresholds exceeded simultaneously | Capacity reduction required; monitor closely |
| -1 | Unfavorable | Single critical threshold exceeded | Exercise caution; verify with measurements |
| 0 | Neutral | All parameters within normal range | Static rating applies |
| +1 | Favorable | Single favorable threshold met | Consider moderate capacity increase |
| ≥ +2 | Very Favorable | Multiple favorable conditions simultaneously | Significant capacity increase possible |
Multi-scale weather forecasting
An added value of this pilot service is the integration of multi-scale numerical weather prediction (NWP). The service combines forecasts from continental to local scales to support different operational time horizons and decision needs. Forecast variables are translated into the projected DLR condition score, allowing operators to anticipate upcoming operating conditions.
- Continental scale (9.0 km resolution): ECMWFEuropean Centre for Medium-Range Weather Forecasts More IFS ensemble forecasts (~9 km resolution) are used to obtain a 48-hour DLR condition detection across Europe, enabling identification of regions requiring detailed analysis.
- Global Extremes Digital Twin (4.4 km resolution): The ECMWFEuropean Centre for Medium-Range Weather Forecasts More IFS-based Digital Twin provides the foundation for continental-scale DLR assessment at ~4.4 km resolution. This enables probabilistic early warning of unfavorable DLR conditions 2-5 days ahead across Europe.
- Regional scale (2.5 km resolution): AROME/ALARO forecasts (~2.5 km resolution) provide high-resolution analysis for Austrian (GeoSphere Austria) and Belgian (RMI) domains, capturing meteorological features relevant to transmission corridors, such as valley winds, sea breezes and frontal passages.
- Hectometric scale (0.5 km resolution): DestinE regional Extremes Digital Twin data (~500 m resolution) enables sub-kilometer analysis for critical line segments, essential for capturing microclimate variations in complex terrain. This resolution captures terrain-induced flow modifications in Alpine valleys and complex coastal zones that are unresolved at coarser scales.
First results
Initial results in Belgium and Austria highlight the strong potential of this pilot service. Analyses conducted with transmission system operators such as Elia and Austrian Power Grid demonstrate significant spatial and temporal variability in line capacity.
For example, in Belgium, favorable wind conditions led to average capacity increases of up to 170% compared to static ratings. The service also enables detailed identification of bottleneck segments along transmission corridors, supporting targeted monitoring and infrastructure planning.
Example Belgium
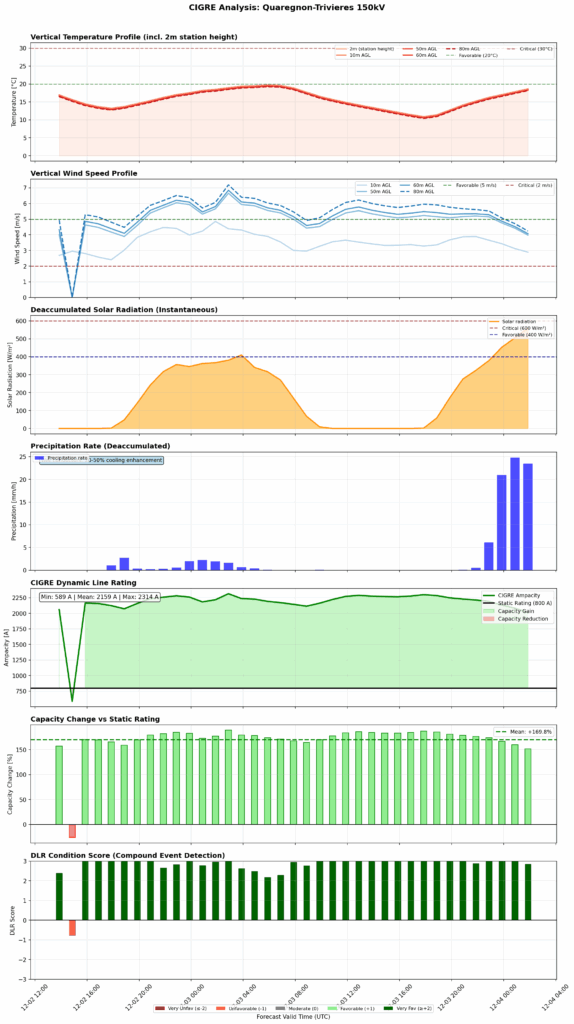
Detailed analysis was performed for Elia’s Quaregnon-Trivieres 150kV transmission line in Belgium using DestinE Extremes hectometric data (~500 m resolution) on 12 February 2026 for a 48-hour forecast period.
For Elia’s Quaregnon–Trivières 150 kV line, high resolution DestinE data revealed predominantly favorable conditions:
- Temperatures between 10–22°C
- Wind speeds of 4–6 m/s for most of the forecast period
- Favorable DLR scores of +2 or +3
The CIGRE model estimated a mean ampacity of 2159 A, a 170% increase over the static rating of 800 A.
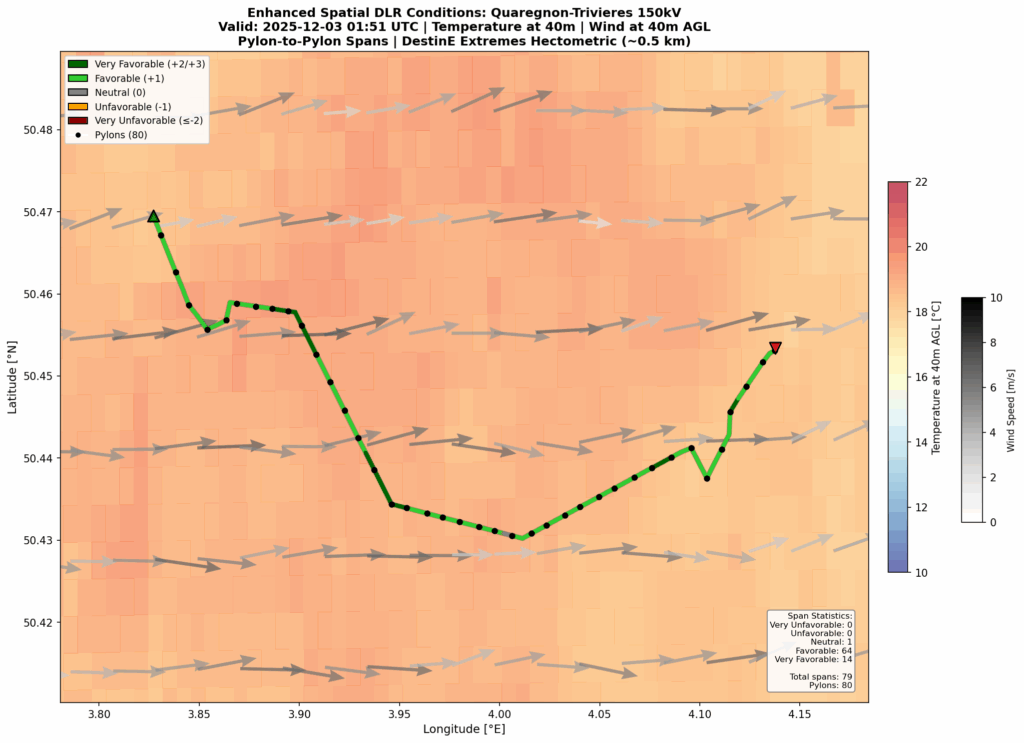
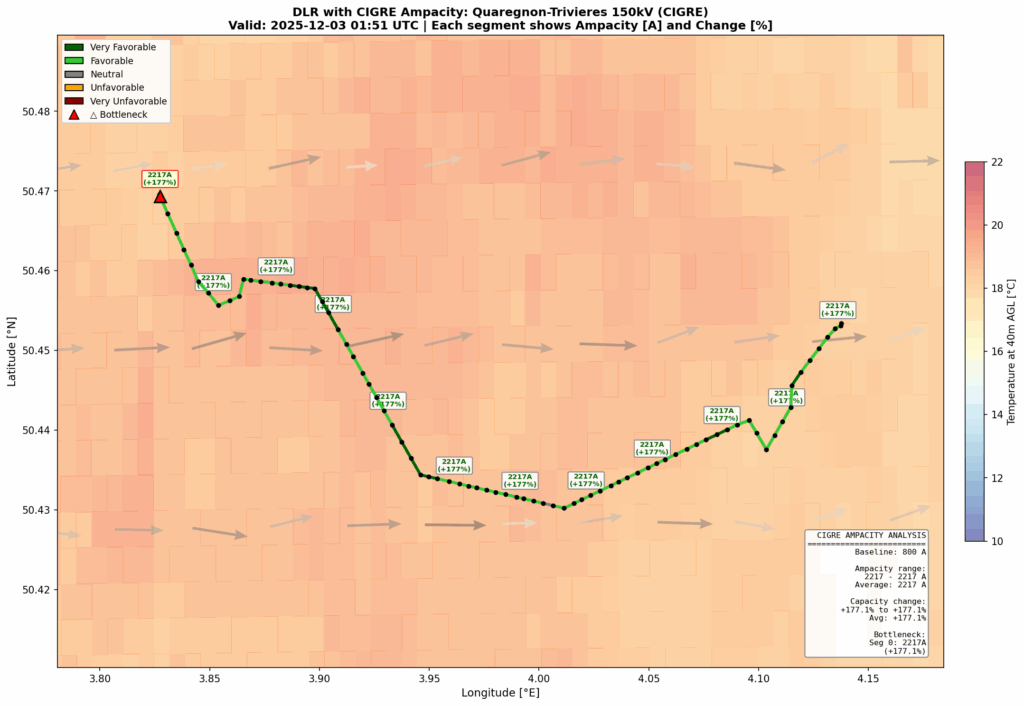
Identifying bottlenecks
An important feature of the pilot service is its ability to identify corridor bottlenecks. Even if most spans show high ampacity, a single unfavorable segment can limit the entire line.
In the Belgian case study:
- 70 of 79 spans were favorable
- But one northern segment, with lower wind and higher temperature, capped the corridor at 2144 A
Despite favorable conditions elsewhere reaching 2300+ A, the entire corridor capacity is constrained by this single segment—demonstrating the operational principle that a transmission line’s effective rating equals its weakest link. This spatial granularity enables TSOs to identify specific infrastructure where targeted measurements or localized weather stations would provide the greatest operational benefit.
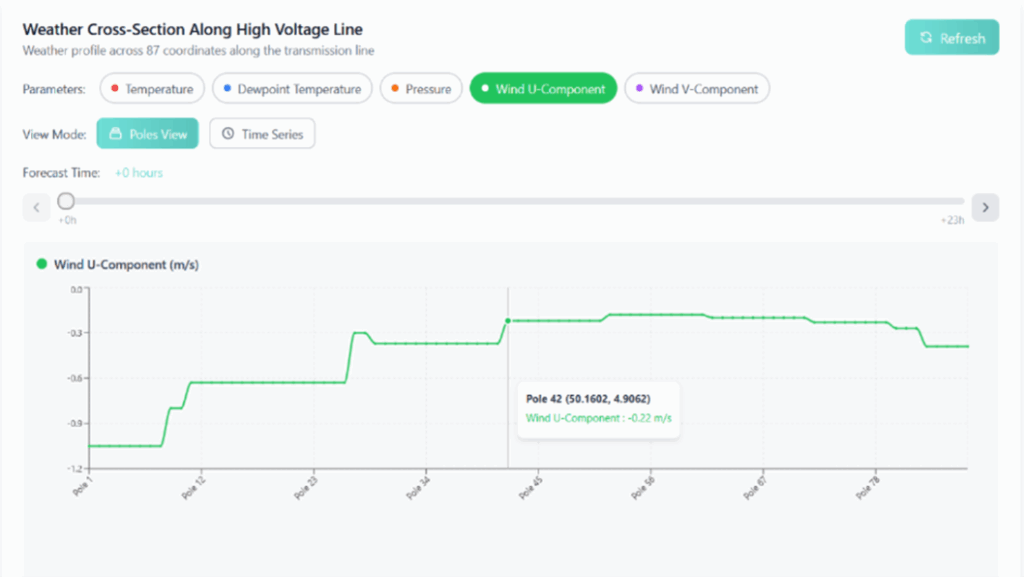
Development of web interface
A web application has been developed to ensure practical usability. Users can upload transmission line coordinates, analyse temporal weather variability along these routes and obtain dynamic capacity estimates. The API enables automated integration of forecasts and indicators into existing operational systems. The application will be publicly available through the DestinE PlatformSelf-standing DestinE system component, interfacing with the More, making it broadly accessible to researchers, decision-makers, and other stakeholders interested in high-resolution environmental data.
Impact for the energy transition
Dynamic Line Rating has the potential to increase grid flexibility, support renewable integration and reduce congestion. The pilot service demonstrates how digital twins and high-resolution forecasts can make this approach operational.
Future developments will focus on probabilistic forecasting, uncertainty quantification and machine learning, supporting wider deployment and contributing to a more resilient and efficient European energy system.